

Quick answer
You measure AI search visibility by running a fixed set of buyer questions against each AI engine on a schedule, under fixed conditions, and recording the result separately per engine.
No single number captures it. A usable measurement needs six things:
- A defined prompt set of real buyer questions, not your brand name.
- Repeated runs, because one run is a sample of one.
- Fixed conditions: the same region, language, prompt set and cadence.
- Separate records for mention, prominence, citation and sentiment.
- Per-engine reporting, with any aggregate shown alongside the detail rather than in place of it.
- A link to analytics and pipeline where the data allows it, and a stated limit where it does not.
Key Takeaways
- AI visibility is an outcome you measure, not a tactic you run. GEO and AEO are the work. This is the reading you take afterwards.
- The prompt set is the measurement instrument. Change the questions and you change the number, so the set belongs next to the score.
- Engines disagree more than they agree. Coverage and citation behaviour diverge enough per engine that an average hides the decision you need to make.
- No single source closes the attribution loop. Search Console, GA4 and self-reported attribution each miss something different.
What AI Search Visibility Actually Measures
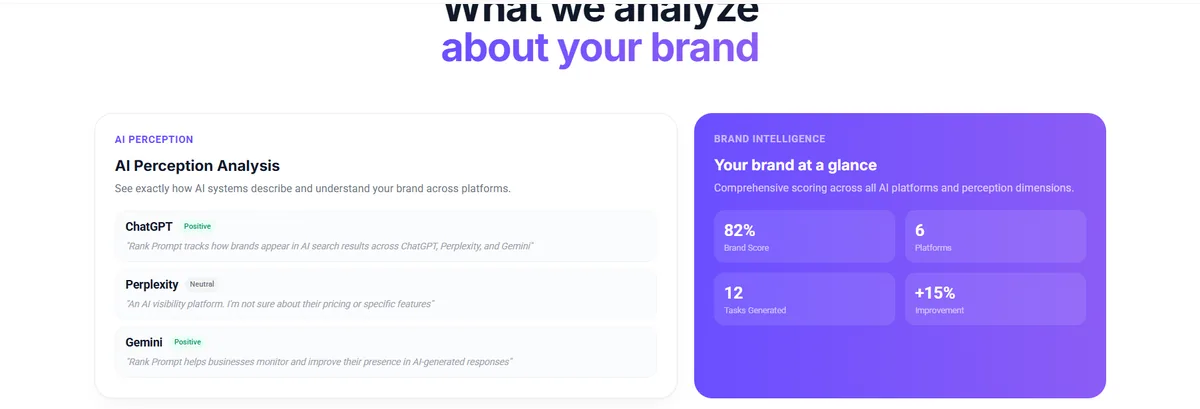
Sentiment and accuracy sit outside every presence metric, which is why they need their own scores. Dimension scores shown are illustrative product marketing, not measured data.
AI search visibility is the measured rate at which a brand appears inside AI-generated answers to a defined set of questions, recorded per engine, along with how prominently it appears and how accurately it is described.
It is a rate, not a rank. An AI answer has no position seven, so the unit is coverage across questions rather than a place in a list.
The 2026 survey of 45 GEO studies frames it the same way, calling this “not a single ranking task but a stochastic, partially observable pipeline” and proposing “a visibility vector separating discoverability, citation, absorption, and economic outcomes.”
A vector, not a number. That is the argument this guide is built on.
Five outcomes get treated as one, and they are not.
- You can be mentioned without being cited, which builds memory and sends no traffic.
- You can be cited without earning a click, since the answer already served the reader.
- You can receive AI referral traffic while scoring near zero on tracked prompts, because the traffic came from questions you never tracked.
- You can win branded prompts and lose category prompts, which is the most flattering way to be invisible.
- You can hold high visibility with an inaccurate description, which is worse than absence.
That last risk is measurable. The Tow Center tested eight generative search tools and found they “provided incorrect answers to more than 60 percent of queries.”
The metrics worth separating
| Metric | What it measures | What it cannot prove |
|---|---|---|
| Prompt coverage | Share of tracked questions where you appear | That the questions matter commercially |
| Brand mention rate | How often you are named at all | That the mention was favorable |
| Prominence | Where in the answer you appear | That the reader acted on it |
| AI share of voice | Your mentions against all brands named | Anything, unless entity names are normalized |
| Citation frequency and ownership | How often your URLs are sources, and which ones | How much is engine design rather than merit |
| Sentiment and accuracy | Whether the description is favorable and correct | Where the error originated |
| Stability over time | Variance across repeated runs | Direction, until the variance is known |
| Referral traffic and conversions | What reached the business | The AI Overviews share, which analytics does not isolate |
Prominence is the one teams skip most often, and it has the strongest academic grounding. The original GEO paper scored visibility with a position-adjusted word count rather than a binary appeared-or-not flag.
Being named last in a six-vendor list is not the same result as being named first, and a mention-rate metric records them identically.
What 14 Reports on One Brand Revealed
We ran this on ourselves rather than arguing it in the abstract.
Method. On 30 July 2026 we ran 14 separate reports for one brand, Rank Prompt, through the Rank Prompt API. Each used a different 5-prompt set on a different topic in the same category.
Every report held the same seven engine surfaces, the same country (United States), the same language (English) and the same date. That is 70 prompts and 490 prompt-by-engine cells, with only the questions varying.
Why seven surfaces and not six platforms. Rank Prompt tracks six AI platforms. This study measured surfaces, which is a different count:
- ChatGPT and Claude were each measured twice, with web search and without, because the two modes behave differently enough to be separate measurements.
- Perplexity, Google AI Overviews and Grok contributed one surface each.
- Gemini was not part of this batch, so five of the six tracked platforms are represented.
Result: the visibility score ranged from 0.00% to 14.29%. Eight of the fourteen returned exactly zero. Any one of them could have been screenshotted into a board deck as “our AI visibility.”
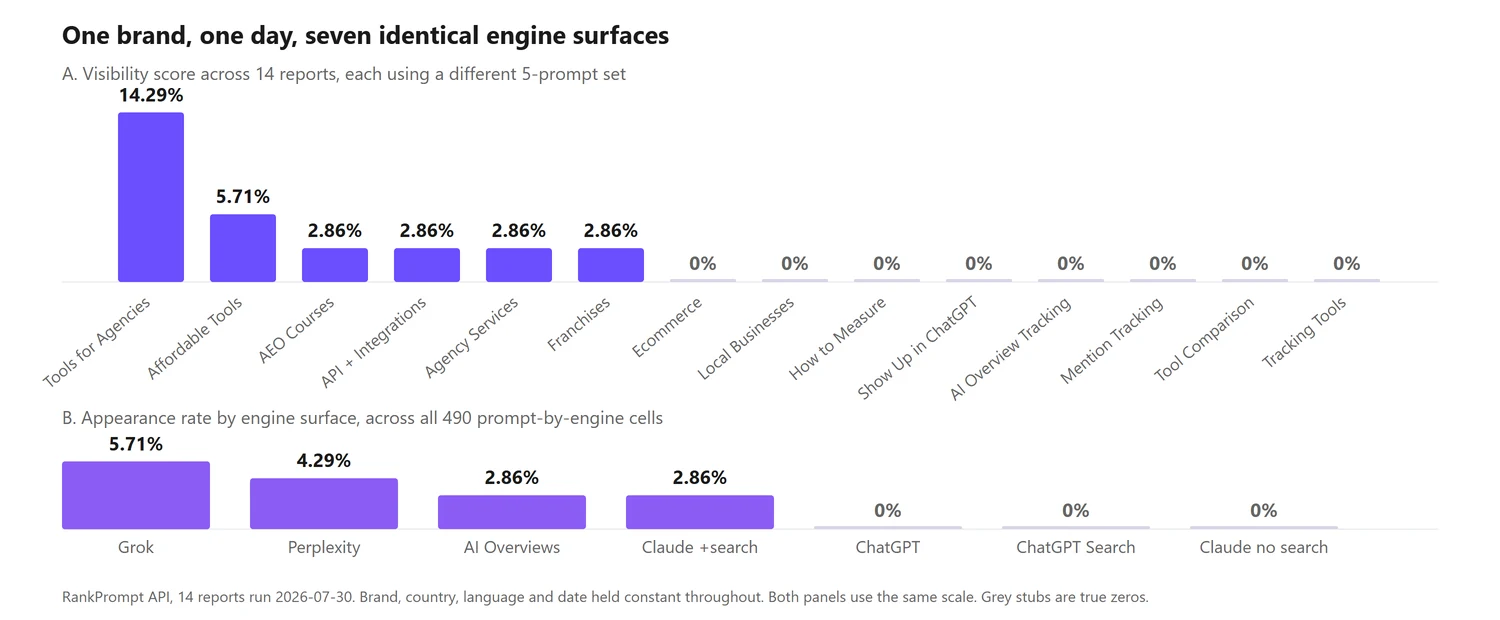
Same brand, same day, same seven engine surfaces. Only the prompt set changed between the 14 reports. Built from the Rank Prompt API pull described in the method note.
Everything else was held constant, so the choice of questions accounted for the entire spread. Treat the size of that spread as an illustration rather than a constant, and the direction as the transferable finding.
The same caution applies over time. Our own scores across four older reports read 28.00%, 13.04%, 1.25% and 3.75%, which looks like a collapse until you notice each run used a different prompt count and a different engine list. We do not publish that as a trend, and neither should you.
Three engine-level findings mattered more than the headline.
First, the brand appeared in 11 of 490 cells, or 2.24% overall, but that splits into 5.71% on Grok and 0.00% on ChatGPT, as panel B shows. Same brand, same questions, same morning.
Second, the engines barely agree on sources. Taking each prompt on its own, so the question and the moment are identical, 87.45% of the cited URLs were cited by exactly one engine. Roughly seven of every eight sources that earned a citation earned it in one place only.
Third, citation volume is partly engine architecture rather than merit. Across the same answers, mean citations per answer ranged from 25.5 on Grok to zero on Claude without search, which returned no citations in all 70 answers by design.
| Engine surface | Mean citations per answer | Answers with zero citations |
|---|---|---|
 Grok Grok | 25.5 | 0 of 70 |
 Google AI Overviews Google AI Overviews | 18.9 | 0 of 70 |
 Perplexity Perplexity | 14.5 | 0 of 70 |
 Claude (search enabled) Claude (search enabled) | 13.2 | 0 of 70 |
 ChatGPT Search ChatGPT Search | 4.2 | 7 of 70 |
| ChatGPT | 3.2 | 30 of 70 |
| Claude (no search) | 0.0 | 70 of 70 |
Your citation rate on an engine that returns 25 sources is not comparable to your rate on one that returns three. The vendors document the split themselves, in the OpenAI, Anthropic and Perplexity crawler documentation.
Method and limitations. Rank Prompt API, brand
8cdcfcb7, 14 reports created 2026-07-30, pulled 2026-08-03. Scope: 70 prompts, 7 engine surfaces, 490 cells, 5,568 citation events across 3,565 unique URLs and 1,659 domains. Conditions: United States, English, one brand, one category (B2B software and marketing technology). Limits: five prompts per report is a small set, presented as evidence of variance rather than as a tracking baseline. One brand in one category will not generalize to consumer retail, healthcare or local services. Competitor name counts are model-extracted from answer text and carry extraction error.
Step 1: Build and Govern Your Prompt Set
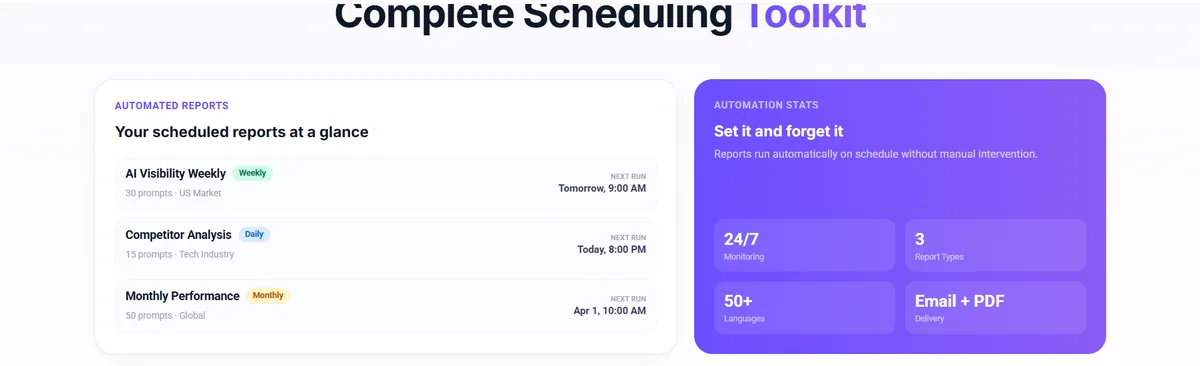
A governed prompt set in practice: a fixed core, a stated cadence and a region per run.
The prompt set is the instrument. Build it badly and every downstream number inherits the error.
Start from questions buyers actually ask: category questions where shortlists form, problem questions asked before vendors are known, comparison and alternatives questions, and qualifiers by budget, industry or region.
No published standard sets a correct prompt count. Thirty to fifty for a single category is a practical starting point in our experience, adjusted to how many distinct questions your buyers ask.
Keep branded prompts to roughly a tenth of the set and score them separately. Asked about your company by name, an assistant will describe your company, which says nothing about whether you win the category.
Govern the set rather than freezing it. A set frozen forever stops describing your market. A set edited casually destroys the series.
- Keep a stable core set that carries the trend, and change it rarely.
- Version every material change with a date and a note on what moved.
- Put new prompts in a separate expansion set so they can be assessed without disturbing the core.
- Preserve historical baselines rather than restating them, so old periods stay readable on the basis they were measured.
Revisit the core when something real changes: a new product or market, a competitor entering or leaving, or a clear shift in how buyers ask.
Step 2: Set a Baseline You Can Defend
A baseline is not your first run. It is the first run you could defend in a quarterly review.
Fix and write down the conditions: region and language, the exact engine list including whether search is enabled, the prompt set version, and the cadence.
Run it more than once first. A study of five LLMs configured to be deterministic found “accuracy variations up to 15% across naturally occurring runs” with a best-to-worst gap “up to 70%.” Even at fixed settings, numerical sources of nondeterminism make identical repeat outputs unlikely at scale.
Three runs is a practical starting point rather than a standard. Record the range, not just the mean, because without it you cannot separate movement from noise.
Step 3: Compare Engines Without Averaging Them Away
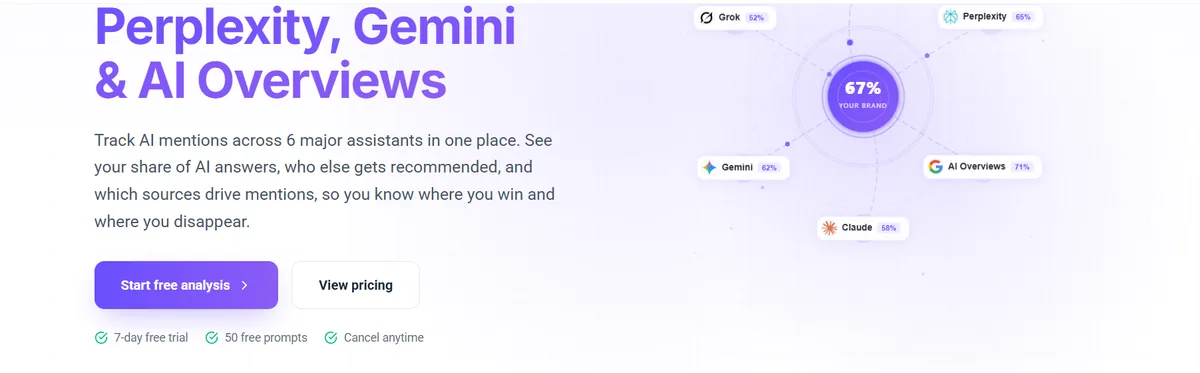
Each engine carries its own figure rather than one blended score. Percentages shown are Rank Prompt’s own illustrative product marketing, not measured data.
This is where an aggregate misleads most easily, and the study above shows why: the same brand on the same morning read as 5.71% on one engine and 0.00% on another.
Weight engines by where your buyers ask rather than by which one flatters you. An aggregate weighted toward the most citation-heavy engine can rise with no matching change in what buyers see.
When an aggregate score does earn its place
A single roll-up number is not invalid. Executives need a trend line, and a board will not read a seven-column table every month. An aggregate works when all five of these hold:
- The methodology stays stable, and any weighting does not change quietly between periods.
- The weighting is disclosed or applied consistently.
- The underlying prompt set stays comparable.
- The per-engine results stay available underneath, so movement can be decomposed.
- It is not presented as a market benchmark.
For the narrower job of logging and interpreting brand mentions once this grid is running, see our guide to tracking brand mentions in AI search.
Step 4: Track Change Over Time
Change is the only reason to measure twice, and it is the easiest thing to fake.
Keep the prompt set, engine list, region, language and cadence stable, and record any change to them. Segment the trend by engine and by prompt category, since a flat overall line often hides one engine falling and another recovering.
Cadence is a judgement call rather than a standard. Weekly suits an active campaign if you accept that much weekly movement is noise, monthly suits most reporting cycles, and quarterly suits the accuracy and sentiment audits done by hand.
Annotate every run with what you shipped that period, or you will have a chart and no causality. The 2026 GEO survey found that “no reviewed technique shows a stable, longitudinal, cross-platform causal effect on organic discoverability,” so present correlation as correlation.
Step 5: Connect Visibility to Traffic and Revenue
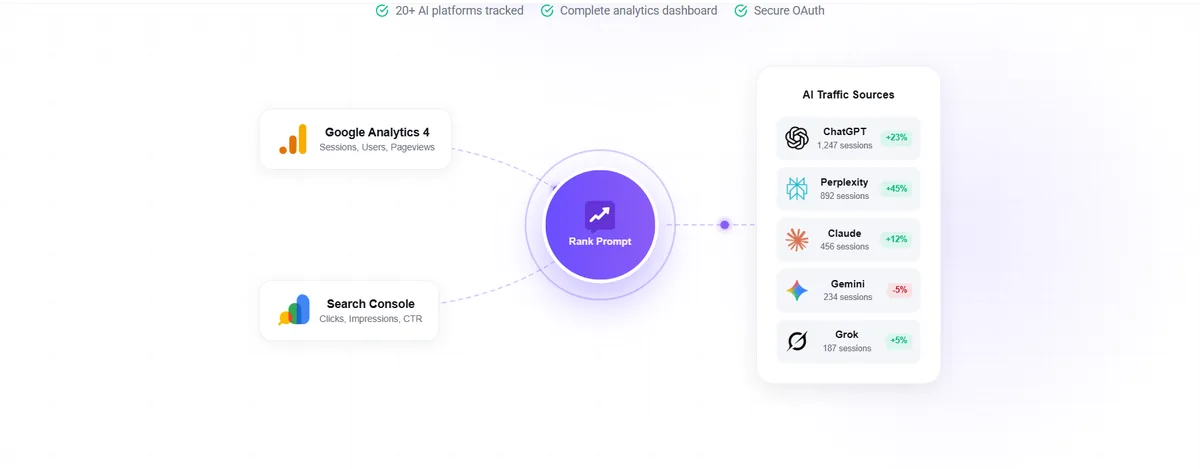
The attribution chain: GA4 and Search Console on one side, per-assistant AI sessions on the other. Session figures shown are illustrative product marketing, not measured data.
This is the layer most measurement guides skip, and where the honest limits live.
Search Console reports impressions only. Its generative AI performance report covers “AI Overviews, AI Mode” and shows “how many times links to your site were shown to a user in a generative AI feature.” There are no clicks, no CTR and no position. Google introduced it in June 2026, rolling out to a subset of properties.
GA4 classifies assistants, with one large exception. The default channel group includes an AI Assistant channel, assigned when “the medium exactly matches ‘ai-assistant’,” covering “sources like ChatGPT, Gemini, Deepseek, Copilot, or Grok.”
That channel “excludes Google’s AI Overviews and AI Mode.” Those visits sit inside Organic Search instead, because Google’s AI features documentation describes both as part of Search running on the same systems.
No single source closes the loop, so name the gap each one leaves:
- Search Console gives generative AI impressions for eligible properties, and stops short of clicks, CTR and position.
- GA4 separates assistant referrals, and does not isolate AI Overviews or AI Mode within them. A custom channel group gives finer source control but cannot recover what arrives as organic.
- Self-reported attribution on your main form surfaces commercial influence the other two miss, and is voluntary, partial and subject to recall error.
Expect modest volumes. Pew Research found users clicked a result on 8% of visits where an AI summary appeared against 15% without one, and clicked inside the summary just 1% of the time. Cloudflare shows AI platforms fetching pages at very high ratios against the referrals they return.
AI visibility can create value without producing a directly attributable click, so judging it on sessions alone understates it. Traffic and conversions still matter, so report the visibility series next to brand measurement and keep the referral and conversion lines alongside it with the gaps named.
Common AI Visibility Measurement and Benchmarking Mistakes
- Reporting one engine as AI visibility. Our own data ranged from 0.00% to 5.71% across engines on a single morning.
- Measuring with branded prompts. Reliably flattering, and it predicts nothing about category demand.
- Reading a single run as fact. Repeated identical queries vary by design, so one run is a sample of one.
- Skipping entity normalization. In our corpus one competitor appeared under 26 distinct name strings. Merging the variants nearly doubled its share of voice and reordered the leaderboard.
- Treating citation count as a quality score. It tracks how many sources that engine emits more than how good your page is.
- Comparing scores across vendors or against a published benchmark. No universally comparable AI visibility benchmark currently exists. A score of 40% against fifteen easy prompts and 12% against fifty hard commercial prompts are not on the same scale, and no shared method has been published that would put them there.
Three comparisons do hold up: against yourself over time on a stable core set, against named competitors measured inside the same run, and against the ceiling, meaning the share of your tracked prompts any brand wins at all.
When an AI Visibility Platform Becomes Useful
You can run this manually, and most teams should once, because it teaches you what the numbers mean. Manual measurement is fine below roughly 20 prompts, on one or two engines, for a one-off answer rather than a series.
A platform starts paying when the grid gets big, when you need repeatability that hand-run queries cannot give, when you need citation-level data rather than just whether your name appeared, when you need per-region splits, or when a client needs the method to be auditable. Fifty prompts across seven surfaces is 350 cells per run, and three runs for variance makes 1,050.
History is the one thing you cannot buy later. Retroactive measurement is impossible, so starting small and early beats starting comprehensive and late.
Where Rank Prompt fits. Scheduled reports run a fixed set daily, weekly or monthly across all six tracked platforms, with 50+ countries and languages for regional splits. AI visibility monitoring keeps each engine separate rather than blending them, citation tracking returns the source URLs behind each answer, and brand audit scores accuracy and sentiment. Analytics connects GA4 and Search Console, subject to the AI Overviews exclusion above.
Rank Prompt does not remove the analytical work. It removes the transcription, scheduling and arithmetic required to repeat it consistently.
Check your AI visibility free → See whether ChatGPT and Google AI Mode (AI Overviews) name your brand today, from their live answers.
AI Visibility Measurement Checklist
- Write the prompt set down and publish it beside the score. Without it the number is hard to interpret or compare.
- Keep branded prompts in a separate bucket so they never inflate the headline coverage number.
- Run the baseline more than once and record the range, not just the mean.
- Report per engine. Put any aggregate on top of the engine table rather than in place of it.
- Write down your weighting the first time you publish a roll-up, and flag it whenever it changes.
- Ask your vendor how they normalize brand names. If there is no answer, discount the share-of-voice figure.
- Annotate every run with what you shipped, and say “associated with” rather than “caused”.
- Label your AI traffic number a floor, name the AI Overviews exclusion, and add a self-reported attribution field to your main form.


 ChatGPT